

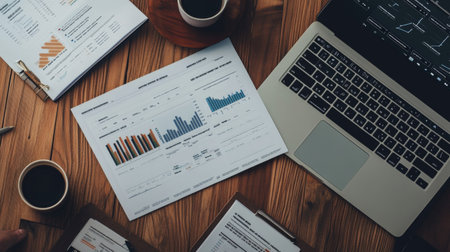
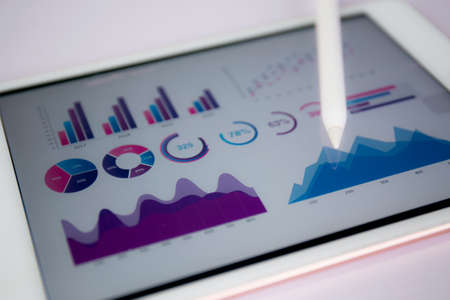
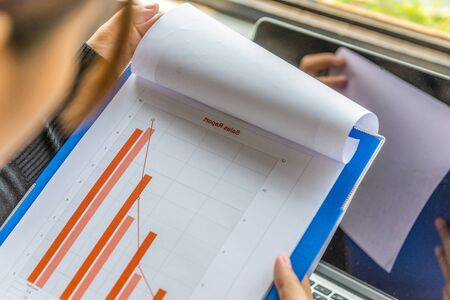
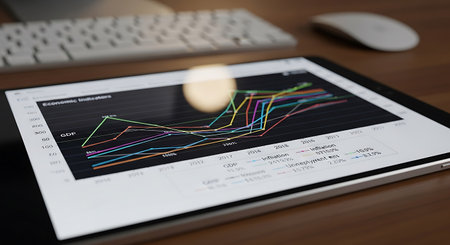
Team work with results and reports
Коллекция по умолчанию
Коллекция по умолчанию
Создать новую

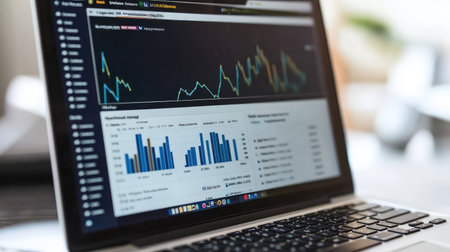
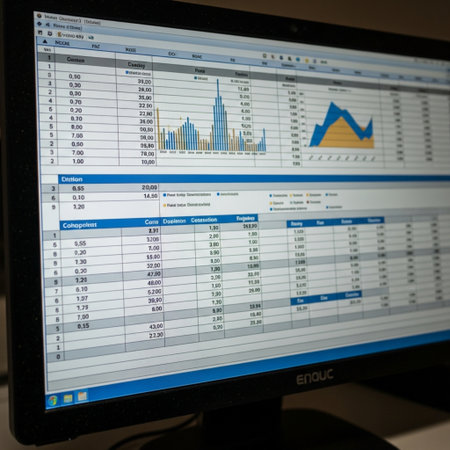
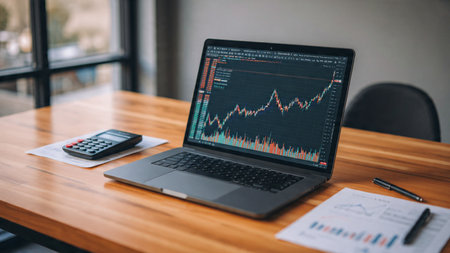
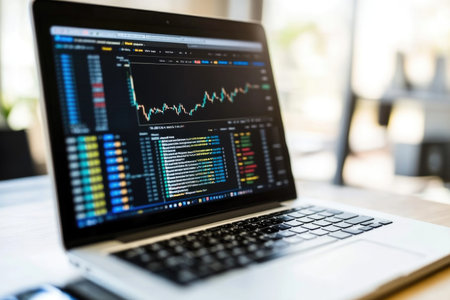
Shallow depth of field (selective focus) with details of a chart showing the stock market crash from March 2020 due to the Covid-19 pandemic on a computer screen (S&P500 index)
Коллекция по умолчанию
Коллекция по умолчанию
Создать новую

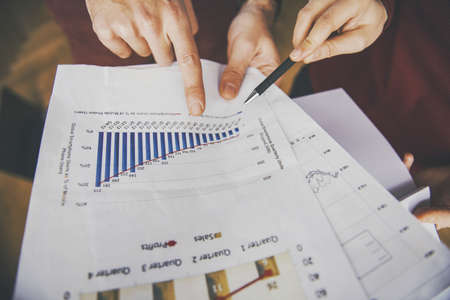
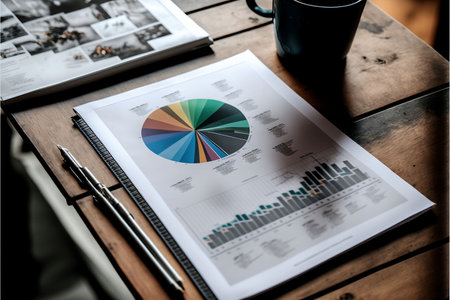
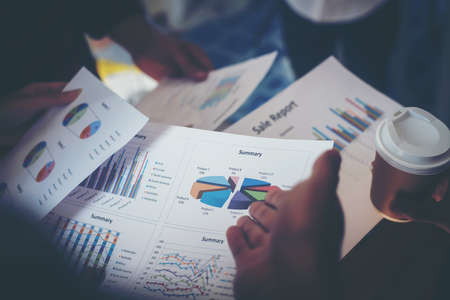
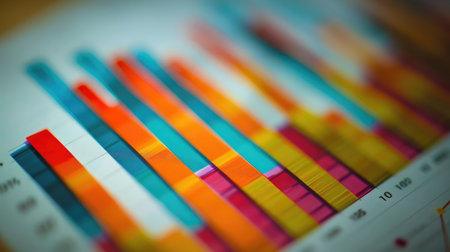
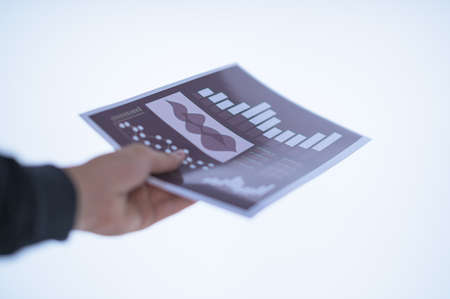
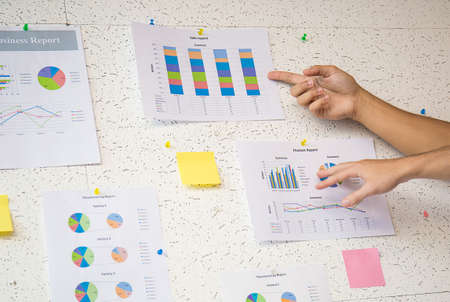
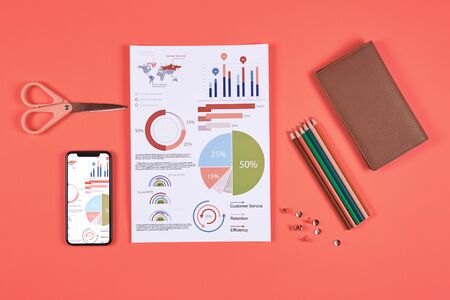
Annual business report. Accountability paperwork. Hands holding a heap of documents with graphs and statistics
Коллекция по умолчанию
Коллекция по умолчанию
Создать новую
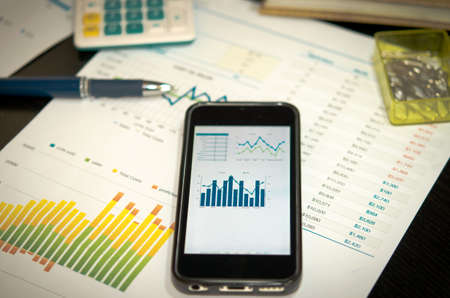
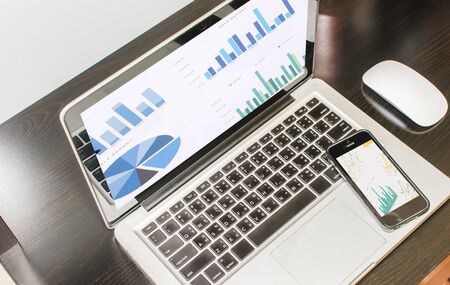
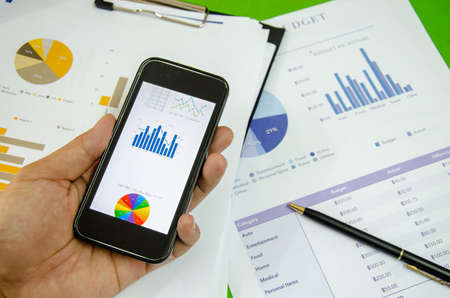
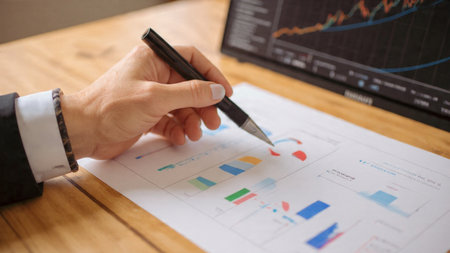
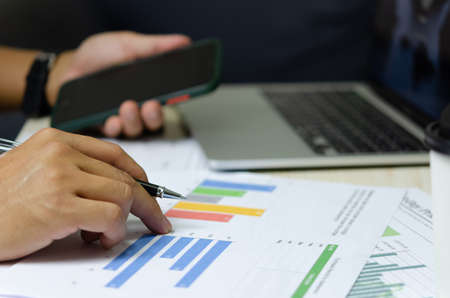
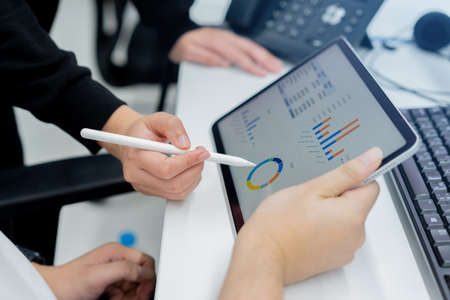
Business chart with smart phone and pen
Коллекция по умолчанию
Коллекция по умолчанию
Создать новую

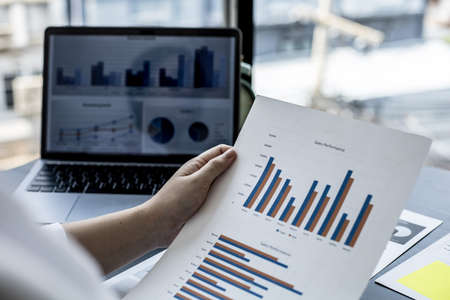
Businessmen miniature figure standing on investment and profit graph for analysis and discussion.
Коллекция по умолчанию
Коллекция по умолчанию
Создать новую

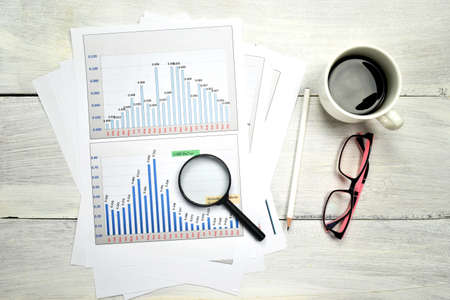
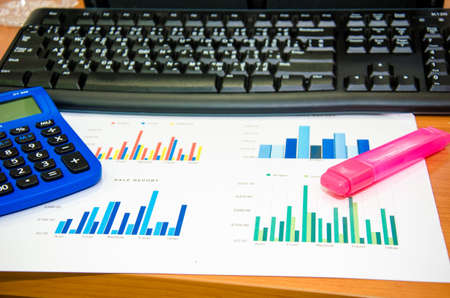
business analysis and statistics concept, desk with mixed graphs and charts on notebook with magnifying glass on it
Коллекция по умолчанию
Коллекция по умолчанию
Создать новую
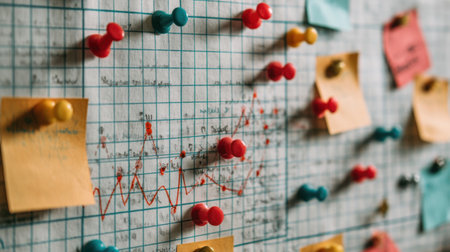
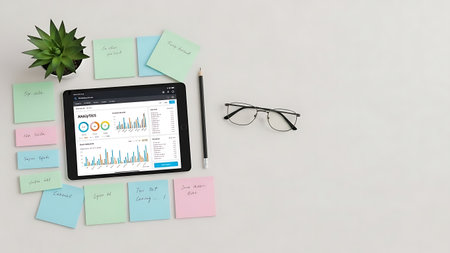
A visually engaging workspace featuring colorful push pins and sticky notes on graph paper, illustrating data representation and enhancing creative organization for projects.
Коллекция по умолчанию
Коллекция по умолчанию
Создать новую

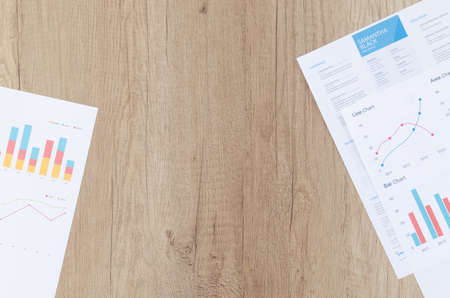
Business plan documents and charts for eco-tourism startup on rustic wooden table
Коллекция по умолчанию
Коллекция по умолчанию
Создать новую
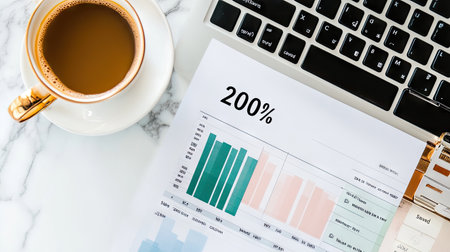
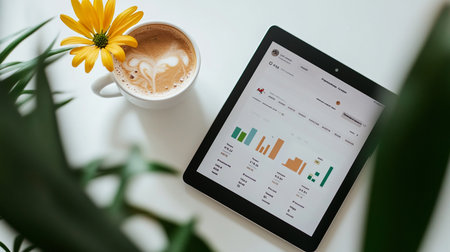
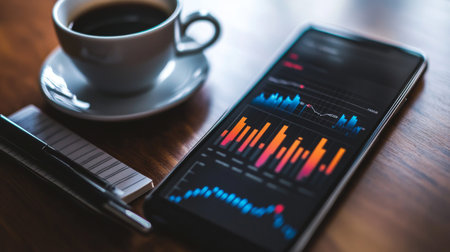
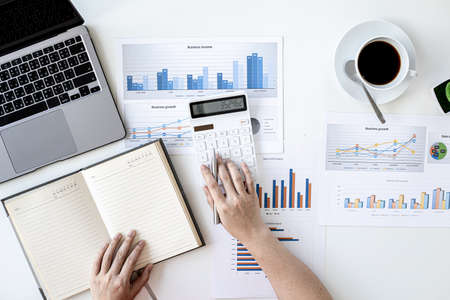
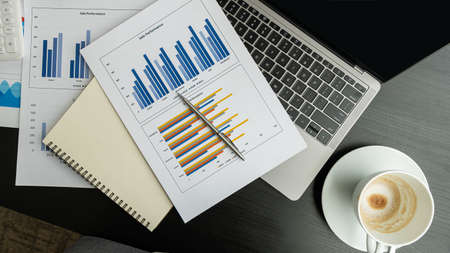
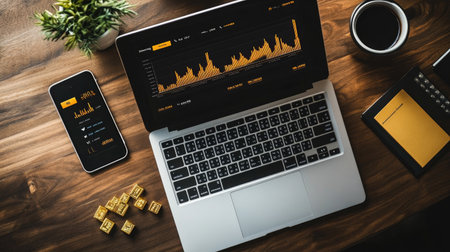
A modern workspace scene featuring a cup of coffee beside a laptop, with charts and graphs showcasing data analysis for productivity and business growth.
Коллекция по умолчанию
Коллекция по умолчанию
Создать новую
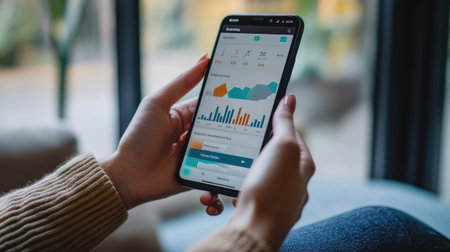
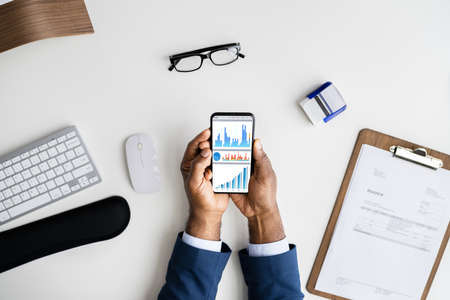
A close-up of hands holding a smartphone with a banking app, showing a financial graph of account balances and transactions.
Коллекция по умолчанию
Коллекция по умолчанию
Создать новую

top view of man hand with pen analyzing bar chart on paper.
Коллекция по умолчанию
Коллекция по умолчанию
Создать новую
Businessman hand holding a document. Scenes white background.
Коллекция по умолчанию
Коллекция по умолчанию
Создать новую
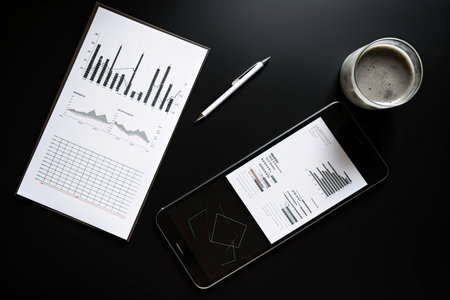
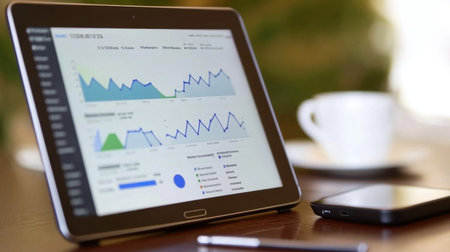
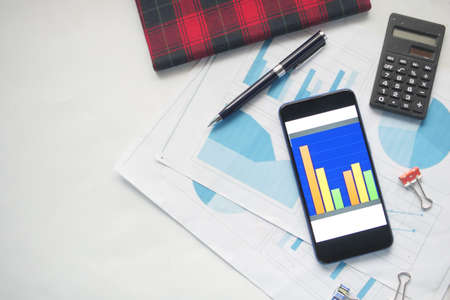
Smartphone and Tablet pc with financial charts and graphs on office desk, business concept
Коллекция по умолчанию
Коллекция по умолчанию
Создать новую

Child's hand arranging wood blocks in a step stair concept. Concept for growth, strategy, success process or investment goals.
Коллекция по умолчанию
Коллекция по умолчанию
Создать новую
Business reports
Коллекция по умолчанию
Коллекция по умолчанию
Создать новую
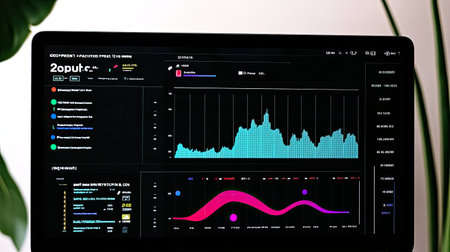
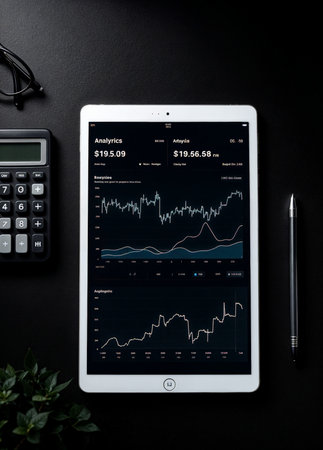
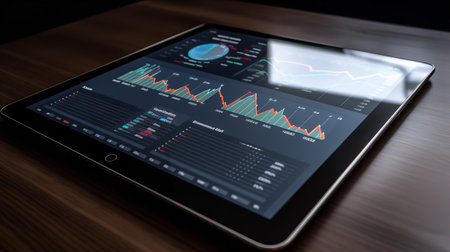
A sleek digital dashboard showcasing market analysis with engaging charts. Ideal for professionals seeking insights into financial performance and trends.
Коллекция по умолчанию
Коллекция по умолчанию
Создать новую

Businesswoman holding a notepad at her desk, a group of businessmen attending a meeting and holding meeting materials, brainstorming meeting to plan a company's growth. Business meeting idea.
Коллекция по умолчанию
Коллекция по умолчанию
Создать новую
business analyzing graphs on laptop
Коллекция по умолчанию
Коллекция по умолчанию
Создать новую
Close-up view of a laptop displaying data analysis with charts and graphs, perfect for showcasing technology, finance, or business analytics themes.
Коллекция по умолчанию
Коллекция по умолчанию
Создать новую

Graph of market share with black pen in business concept
Коллекция по умолчанию
Коллекция по умолчанию
Создать новую
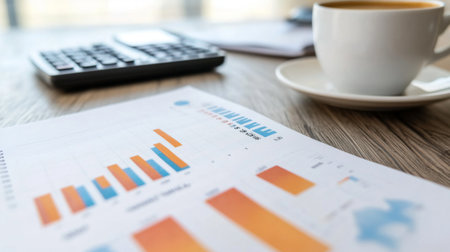
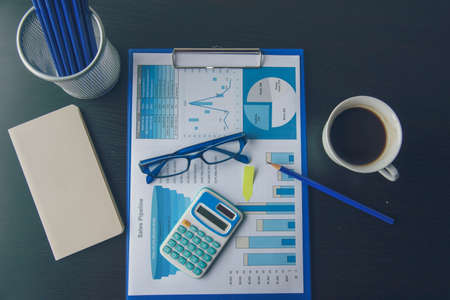
Financial graphs and charts with coffee, glasses, calculator on desk. Business concept.
Коллекция по умолчанию
Коллекция по умолчанию
Создать новую
Workplace on wooden table with graph papers
Коллекция по умолчанию
Коллекция по умолчанию
Создать новую
top view of tablet pc with financial charts on screen and office supplies on table
Коллекция по умолчанию
Коллекция по умолчанию
Создать новую

Virus pandemic covid-19 map on pc screen, global infection, internet.
Коллекция по умолчанию
Коллекция по умолчанию
Создать новую
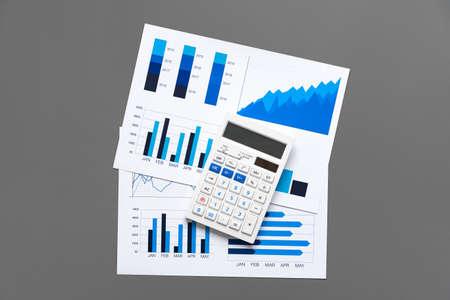
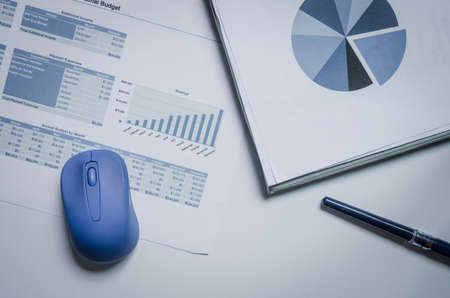
Financial paper with charts and diagrams on gray table
Коллекция по умолчанию
Коллекция по умолчанию
Создать новую
Monthly percentage bar chart showing financial comparison of 2026 budget versus actual performance data displayed on digital screen. Results tracking.
Коллекция по умолчанию
Коллекция по умолчанию
Создать новую
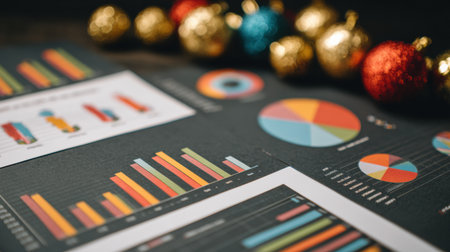
Charts and graphs display data insights on a table, while vibrant holiday ornaments add a festive touch to the workspace, creating a cheerful atmosphere.
Коллекция по умолчанию
Коллекция по умолчанию
Создать новую

business graph with pen
Коллекция по умолчанию
Коллекция по умолчанию
Создать новую
A high-resolution image of a financial report featuring colorful bar charts and graphs, placed on a desk with a calculator, notepad, and a cup of coffee.
Коллекция по умолчанию
Коллекция по умолчанию
Создать новую

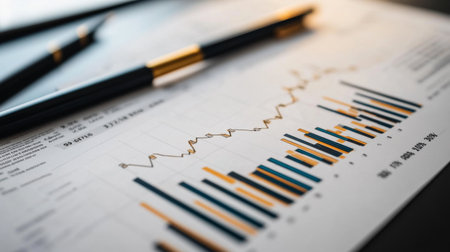
Close-up of a stock market analysis chart with a mix of bar graphs and line graphs highlighting key data
Коллекция по умолчанию
Коллекция по умолчанию
Создать новую
An overhead shot of a desk cluttered with financial reports and a laptop displaying a detailed business graph, capturing the essence of analysis and productivity in the workplace.
Коллекция по умолчанию
Коллекция по умолчанию
Создать новую
A close-up of a printed gold price chart with annotations and trend lines, placed on a desk with financial reports and a pen, emphasizing detailed market analysis.
Коллекция по умолчанию
Коллекция по умолчанию
Создать новую
This image features a tablet showcasing financial graphs and charts, set on a desk beside a smartphone and coffee cup, offering an ideal visual for business analytics.
Коллекция по умолчанию
Коллекция по умолчанию
Создать новую

Colored sticker stripes on business analytics chart closeup
Коллекция по умолчанию
Коллекция по умолчанию
Создать новую

Single Magnifying Glass with Black Handle, Leaning on the financial data. Concept of Business and Finance research .
Коллекция по умолчанию
Коллекция по умолчанию
Создать новую

A stock market graph on a black background.
Коллекция по умолчанию
Коллекция по умолчанию
Создать новую

ballpoint pen indicates income graphs lying on the table
Коллекция по умолчанию
Коллекция по умолчанию
Создать новую
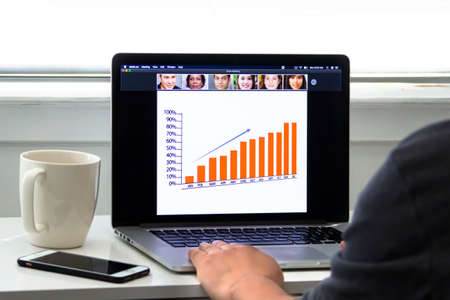
Calgary Alberta, Canada. May 25 2020. An office worker working from home having a Zoom meeting call looking at a presentation on a Macbook with a iPhone plus and a coffee.
Коллекция по умолчанию
Коллекция по умолчанию
Создать новую
African American Man Using Business Analytics On Phone
Коллекция по умолчанию
Коллекция по умолчанию
Создать новую
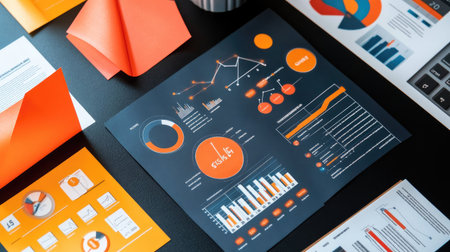
A vibrant collection of data visualization elements including colorful charts and graphs arranged on a dark surface, ideal for business analysis and presentation needs.
Коллекция по умолчанию
Коллекция по умолчанию
Создать новую

Close up Business people meeting to discuss the situation on the market. Business Financial Concept.
Коллекция по умолчанию
Коллекция по умолчанию
Создать новую
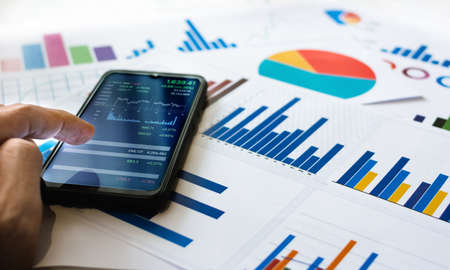
Close up view, asian businessman use finger touching on mobile screen to cheak set index of stocks and analyze chart on paperwork for investment plan
Коллекция по умолчанию
Коллекция по умолчанию
Создать новую

Radiated emissions spectrogram with limit lines in EMC electromagnetic compatibility test report
Коллекция по умолчанию
Коллекция по умолчанию
Создать новую

Calculator, glasses, magnifier and pen with stock investment graph.
Коллекция по умолчанию
Коллекция по умолчанию
Создать новую
reports and histograms on paper on the table in the hands of a girl, analytics and statistics on paper, business analytics
Коллекция по умолчанию
Коллекция по умолчанию
Создать новую
Tablet pc showing charts on screen and a cup of cappuccino
Коллекция по умолчанию
Коллекция по умолчанию
Создать новую
Tablet pc with stock market graphs on screen and office supplies on black table
Коллекция по умолчанию
Коллекция по умолчанию
Создать новую
An AI generated illustration of project management graphs charts paper
Коллекция по умолчанию
Коллекция по умолчанию
Создать новую

Financial report and laptop on business desk
Коллекция по умолчанию
Коллекция по умолчанию
Создать новую
financial chart on a computer monitor, closeup photo with shallow depth of field
Коллекция по умолчанию
Коллекция по умолчанию
Создать новую
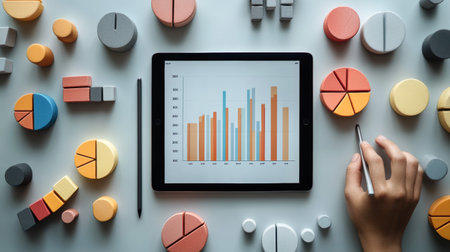
Digital tablet displaying bar charts surrounded by colorful 3D pie charts and blocks. Represents data analysis, business insights, and analytics
Коллекция по умолчанию
Коллекция по умолчанию
Создать новую
business smartphone and pen on desk.
Коллекция по умолчанию
Коллекция по умолчанию
Создать новую
Drawings work calculator documents business desk finance
Коллекция по умолчанию
Коллекция по умолчанию
Создать новую
top view of financial chart display on smart phone on table
Коллекция по умолчанию
Коллекция по умолчанию
Создать новую

Notebook work with statistics on the table
Коллекция по умолчанию
Коллекция по умолчанию
Создать новую

Financial instruments with various types of indicators including volume analysis for professional technical analysis
Коллекция по умолчанию
Коллекция по умолчанию
Создать новую
A smartphone displays vibrant financial data charts next to a steaming cup of coffee and notepad, creating a perfect workspace for business discussions and productivity.
Коллекция по умолчанию
Коллекция по умолчанию
Создать новую
Documents, graphs on a desk.
Коллекция по умолчанию
Коллекция по умолчанию
Создать новую
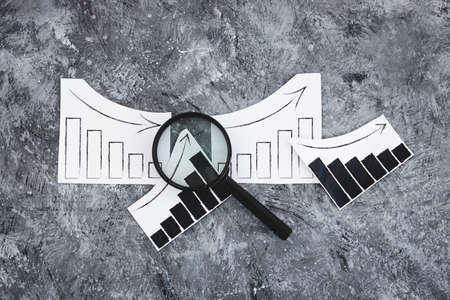
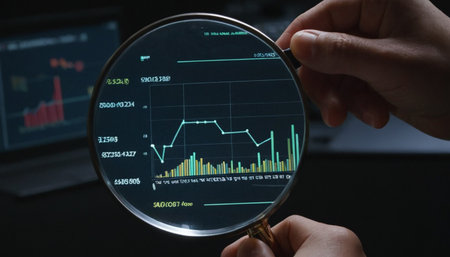
financial markets or money and investments conceptual image, magnifying glass with charts showing upward and downward trends
Коллекция по умолчанию
Коллекция по умолчанию
Создать новую
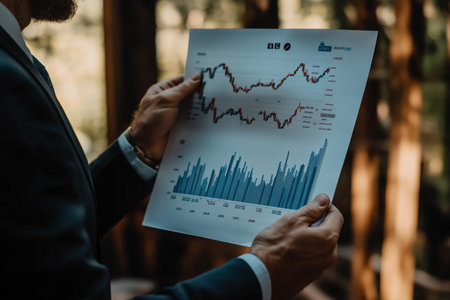
Business professional analyzing financial data in a forest setting during daylight hours
Коллекция по умолчанию
Коллекция по умолчанию
Создать новую
Office laptop business financial document chart and graph on wooden table with coffee cup. Flat lay notebook computer laptop on office desk. No people business graph chart mockup on business workspace
Коллекция по умолчанию
Коллекция по умолчанию
Создать новую

financial graph, calculator and notepad on table
Коллекция по умолчанию
Коллекция по умолчанию
Создать новую
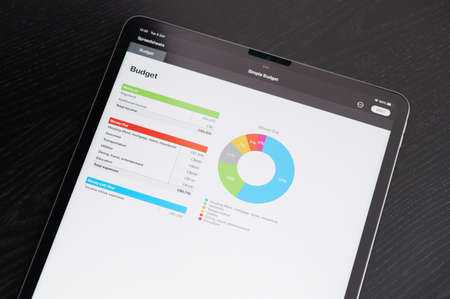
New york, USA - October 5 2021: Budget spreadsheet charts on tablet screen close up view
Коллекция по умолчанию
Коллекция по умолчанию
Создать новую
Business of financial analytics desktop with accounting charts and diagrams
Коллекция по умолчанию
Коллекция по умолчанию
Создать новую
A business finance woman is reviewing a company's financial documents prepared by the Finance Department for a meeting with business partners. Concept of validating the accuracy of financial numbers.
Коллекция по умолчанию
Коллекция по умолчанию
Создать новую
A graph placed on a laptop computer with a coffee cup on the black table in the office
Коллекция по умолчанию
Коллекция по умолчанию
Создать новую
Magnifying glass with stock market data. Stock market data concept.
Коллекция по умолчанию
Коллекция по умолчанию
Создать новую
Business meeting coworkers discussing the project planning in office.
Коллекция по умолчанию
Коллекция по умолчанию
Создать новую
A modern wooden desk showcasing economic trend charts on a laptop, surrounded by research papers and a coffee cup.
Коллекция по умолчанию
Коллекция по умолчанию
Создать новую
Laptop showcasing candlestick charts stands beside analysis sheets and a ceramic coffee mug.
Коллекция по умолчанию
Коллекция по умолчанию
Создать новую

Businesswomen at the office ready to work
Коллекция по умолчанию
Коллекция по умолчанию
Создать новую

Business woman discussing on stockmarket charts in office, working on laptop computer
Коллекция по умолчанию
Коллекция по умолчанию
Создать новую
businessman holding pen to work computer graphs and charts data statistical data financial analysis documents.
Коллекция по умолчанию
Коллекция по умолчанию
Создать новую
A close-up of a business report with colorful bar and line graphs.
Коллекция по умолчанию
Коллекция по умолчанию
Создать новую

image of the financial graph on a computer monitor.
Коллекция по умолчанию
Коллекция по умолчанию
Создать новую
A woman uses a laptop and presses a white calculator, she is a company auditor, she checks documents from the laptop and calculates the numbers for accuracy. Financial audit concept
Коллекция по умолчанию
Коллекция по умолчанию
Создать новую

Defocused Woman holding mobile phone, block chain with graph of stock market background, cryptocurrencies or bitcoin concept. Night light. Futuristic stock exchange with general info shown on screen
Коллекция по умолчанию
Коллекция по умолчанию
Создать новую

Office laptop business financial document chart and graph on wooden table with coffee cup. Flat lay notebook computer laptop on office desk. No people business graph chart mockup on business workspace
Коллекция по умолчанию
Коллекция по умолчанию
Создать новую

Stockmarket online trading chart candlestick on crypto currency platform. Stock exchange financial market price candles graph data pattern analysis concept. Computer screen closeup background
Коллекция по умолчанию
Коллекция по умолчанию
Создать новую
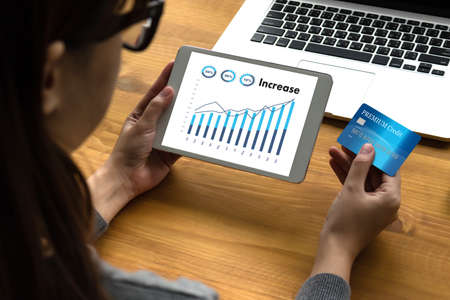
Report graph and chart of investment with finance on tablet computer on desk, datum of stock and growth, planning and statistic with economic, no people, digital marketing, business concept.
Коллекция по умолчанию
Коллекция по умолчанию
Создать новую
Businessman hand holding a document. Scenes white background.
Коллекция по умолчанию
Коллекция по умолчанию
Создать новую
Business people using mobile phone and digital tablet in meeting room at office
Коллекция по умолчанию
Коллекция по умолчанию
Создать новую

Businessman Working on Laptop with Data and Charts
Коллекция по умолчанию
Коллекция по умолчанию
Создать новую

Charts Graphs paper. Financial development, Banking Account, Statistics, Investment Analytic research data economy, Stock exchange Business office company meeting concept.
Коллекция по умолчанию
Коллекция по умолчанию
Создать новую
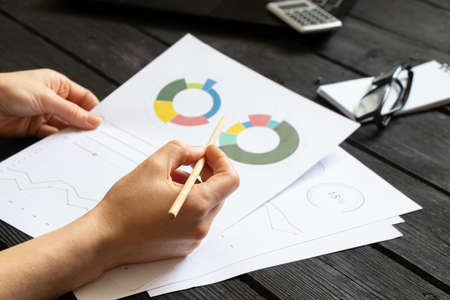
Development of a business plan and business strategy.
Коллекция по умолчанию
Коллекция по умолчанию
Создать новую

Candle stick graph chart with indicator showing bullish point or bearish point, up trend or down trend of price of stock market or stock exchange trading, investment and financial concept.
Коллекция по умолчанию
Коллекция по умолчанию
Создать новую

Business analytics with key performance indicators dashboard concept. Man hand on white background holds Mockup phone with white screen
Коллекция по умолчанию
Коллекция по умолчанию
Создать новую
Woman hand holding sales statistic diagram document
Коллекция по умолчанию
Коллекция по умолчанию
Создать новую
A close-up of graphs and charts displayed on a touch screen tablet, representing data analysis in business operations.
Коллекция по умолчанию
Коллекция по умолчанию
Создать новую

Two businessmen are talking in their office, meeting a marketing plan for solving the problem of falling sales, analyzing the marketing to make sales grow even more. Sales management concept.
Коллекция по умолчанию
Коллекция по умолчанию
Создать новую

Top view Two businessmen pointed to the material for the meeting, working together to plan to develop and solve common business problems. Business management for growth and quality concept. copy space
Коллекция по умолчанию
Коллекция по умолчанию
Создать новую
Hands pointing to strategy on the wall
Коллекция по умолчанию
Коллекция по умолчанию
Создать новую

closeup Office business workplace with laptop on desk computer background document on table copy space workspace creative design books, modern interior
Коллекция по умолчанию
Коллекция по умолчанию
Создать новую
Sales Many charts and graphs Business Increase Revenue Shares Concept
Коллекция по умолчанию
Коллекция по умолчанию
Создать новую
Close-up of digital tablet with financial chart on screen. Business concept
Коллекция по умолчанию
Коллекция по умолчанию
Создать новую

Top view of an organized desk with a computer, coffee cup, and documents, symbolizing a well-prepared business environment.
Коллекция по умолчанию
Коллекция по умолчанию
Создать новую
Minimalist Financial Analysis on Laptop with Stock Market Charts.
Коллекция по умолчанию
Коллекция по умолчанию
Создать новую
Above view flat lay of business data charts and office supplies over coral background, copy space
Коллекция по умолчанию
Коллекция по умолчанию
Создать новую
An overhead view of a financial analyst's desk, featuring a laptop displaying gold price trends, charts, and reports, showcasing the tools used for market analysis.
Коллекция по умолчанию
Коллекция по умолчанию
Создать новую
Clean desk setup for strategic planning with annual growth projection
Коллекция по умолчанию
Коллекция по умолчанию
Создать новую
Legion-Media
Создайте свои проекты на основе качественных стоковых фотографий и видео.


Copyright © Legion-Media.